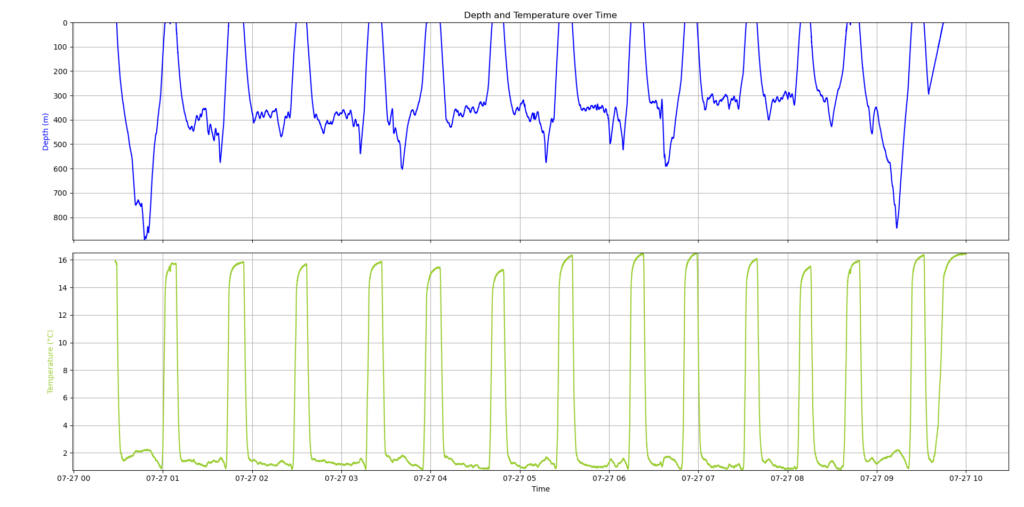
(time, depth, temperature) を含むデータ(data_dt.csv)*を読み込み、以下のような深度と水温の時系列グラフを表示します。
*BiPでOpenデータとなっているKagari Aoki (Teikyo University of Science) 提供のマッコウクジラの潜水データ (title: SW20130726_Rausu_R13_141_27_BiP-TDR_DepthTempSpeed3Acc3Mag_87663_release20130727) の一部を使用しています。

以下のPythonコード(plot_DT.py)をテキストエディタで開き、JupyterLiteのノートブックにコピーして実行(右▼をクリック)します。
import pandas as pd
import matplotlib.pyplot as plt

# CSVファイルの読み込み
data = pd.read_csv('data_dt.csv')

# 日時情報をpandasのdatetime型に変換
data['time'] = pd.to_datetime(data['time'])

# グラフの作成
fig, (ax1, ax2) = plt.subplots(2, 1, sharex=True, figsize=(10, 8))

# 縦軸1(Depth)の設定(青色)
ax1.plot(data['time'], data['depth'], color='blue', label='Depth')
ax1.set_ylabel('Depth (m)', color='blue')
ax1.set_ylim(data['depth'].max(), 0)  # 0を上にしてdepthの最大値を下に設定
ax1.grid(True)
ax1.set_title('Depth and Temperature over Time')

# 縦軸2(Temperature)の設定(黄緑色)
ax2.plot(data['time'], data['temperature'], color='yellowgreen', label='Temperature')
ax2.set_ylabel('Temperature (°C)', color='yellowgreen')
ax2.set_ylim(data['temperature'].min(), data['temperature'].max())
ax2.grid(True)

# 横軸の設定(共通のtime軸)
ax2.set_xlabel('Time')

# グラフの保存
plt.tight_layout()
plt.savefig("output_graph.png", dpi=300, bbox_inches='tight')  # 画像として保存
plt.show()
出力された図は”output_graph.png”という名前でJupyterLite内で保存されているので、ダウンロードしてご利用ください。
