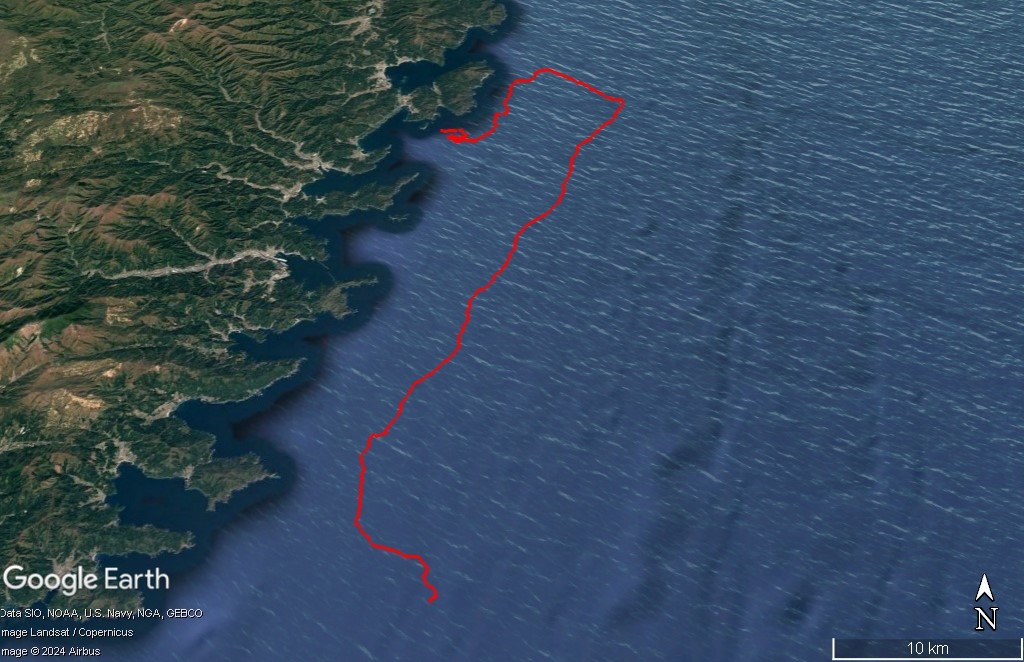
(time, latitude, longitude, height_above_mean_sea_level) の項目を含むGPSデータ(data_gps.csv)*を元にGoogle Earthで表示できるKMLファイルを作成します。ほかのセンサーデータが含まれていてもよく、(height_above_mean_sea_level) がなくてもKMLファイルが作成されます。
下記のコードでは移動経路をTrackとして表示する基本的な機能を提供していますが、KMLファイルの生成に特化したPythonライブラリであるsimplekmlを使用することで、さらに高度な調整が可能になります。例えば、各ポイントに時刻情報を付与したり、カスタムアイコンを設定したりすることで、データの視覚化をより詳細かつわかりやすく行えます。詳しい使用方法や実装例については、こちらのページをご覧ください。
*BiPでOpenデータとなっているKatsufumi Sato (Atmosphere and Ocean Research Institute, University of Tokyo) 提供のオオミズナギドリのデータ (title: 9B41870_TS-AxyTrek_Movebank_YNo.6_release20210824) の一部を使用しています。

以下のPythonコード(generate_kml)をテキストエディタで開き、JupyterLiteのノートブックにコピーして実行(右▼をクリック)します。
import pandas as pd
import xml.etree.ElementTree as ET

# 入力ファイルと出力ファイルのパス
input_file = "data_gps.csv"
output_file = "output.kml"

# CSVファイルを読み込み
df = pd.read_csv(input_file)

# latitude と longitude が空でないデータのみ抽出
df_filtered = df.dropna(subset=['latitude', 'longitude'])

# KMLのルート要素を作成
kml = ET.Element("kml", xmlns="http://www.opengis.net/kml/2.2")
document = ET.SubElement(kml, "Document")

# ラインストリングのための座標リスト
coordinates = []

for index, row in df_filtered.iterrows():
    latitude = row['latitude']
    longitude = row['longitude']
    altitude = row.get('height_above_mean_sea_level', None)
    time = row['time']

    # 高度情報を含む場合と含まない場合で座標を設定
    coord = f"{longitude},{latitude},{altitude}" if pd.notna(altitude) else f"{longitude},{latitude}"
    coordinates.append(coord)

    # 各ポイントのPlacemarkを作成(時刻情報を含む)
    placemark = ET.SubElement(document, "Placemark")
    description = ET.SubElement(placemark, "description")
    description.text = f"Time: {time}"
    point = ET.SubElement(placemark, "Point")
    ET.SubElement(point, "coordinates").text = coord

    # ピンを非表示にするスタイルを設定
    style = ET.SubElement(placemark, "Style")
    iconstyle = ET.SubElement(style, "IconStyle")
    ET.SubElement(iconstyle, "scale").text = "0"  # ピンを非表示にするスケール設定

# ラインストリングを作成
linestring = ET.SubElement(document, "Placemark")
name = ET.SubElement(linestring, "name")
name.text = "Flight Path"
line = ET.SubElement(linestring, "LineString")

# ラインの座標を設定
ET.SubElement(line, "coordinates").text = " ".join(coordinates)

# ラインのスタイル設定
style = ET.SubElement(linestring, "Style")
linestyle = ET.SubElement(style, "LineStyle")
ET.SubElement(linestyle, "color").text = "ff0000ff"  # 赤色(Google Earth形式のABGR順)
ET.SubElement(linestyle, "width").text = "3"  # ラインの太さ

# KMLを保存
tree = ET.ElementTree(kml)
with open(output_file, "wb") as f:
    tree.write(f, encoding="utf-8", xml_declaration=True)

print(f"KMLファイルの作成が完了しました。出力ファイルは {output_file} に保存されています。")
